Tables are a popular way of displaying data in New Relic applications. For example, with the query builder you can create tables from NRQL queries.
Whether you need to have more control over tables or you're importing third-party data, you can build your own tables into your New Relic application.
In this guide, you are going to build a sample table using various New Relic components.
Before you begin
If you haven't already installed the New Relic One CLI, step through the quick start in New Relic. This process also gets you an API key.
In addition, to complete the steps in this guide, you need a GitHub account and Node.js installed on your machine. See Setting up your development environment for more info.
Clone and set up the example application
Clone the nr1-how-to example application from GitHub to your local machine. Then, navigate to the app directory.
The example app lets you experiment with tables.
$git clone https://github.com/newrelic/nr1-how-to.git$cd nr1-how-to/create-a-table/nerdlets/create-a-table-nerdletEdit the index.js file and set this.accountId to your Account ID as shown in the example.
export default class Nr1HowtoAddTimePicker extends React.Component { constructor(props){ super(props) this.accountId = YOUR_ACCOUNT_ID; } ...}Run the demo application.
Change the directory back to nr1-how-to/create-a-table. Before you can load the demo application, you need to update its unique id by invoking the New Relic One CLI.
Once you've assigned a new UUID to the app, install the dependencies and serve the demo app locally, so that you can test any change live in your browser.
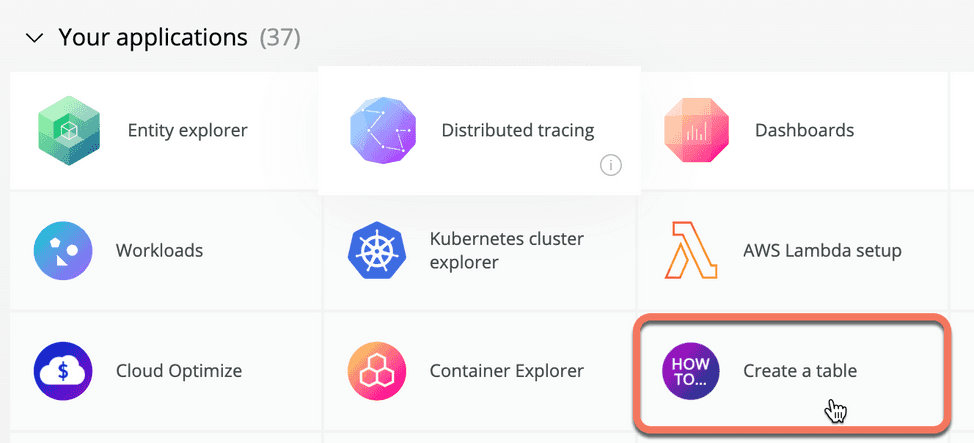
$nr1 update$nr1 nerdpack:uuid -gf # Update the app unique ID$npm install # Install dependencies$nr1 nerdpack:serve # Serve the demo app locallyOpen one.newrelic.com/?nerdpacks=local in your browser. Click Apps, and then in the Your apps section, you should see a Create a table launcher. That's the demo application you're going to work on. Go ahead and select it.

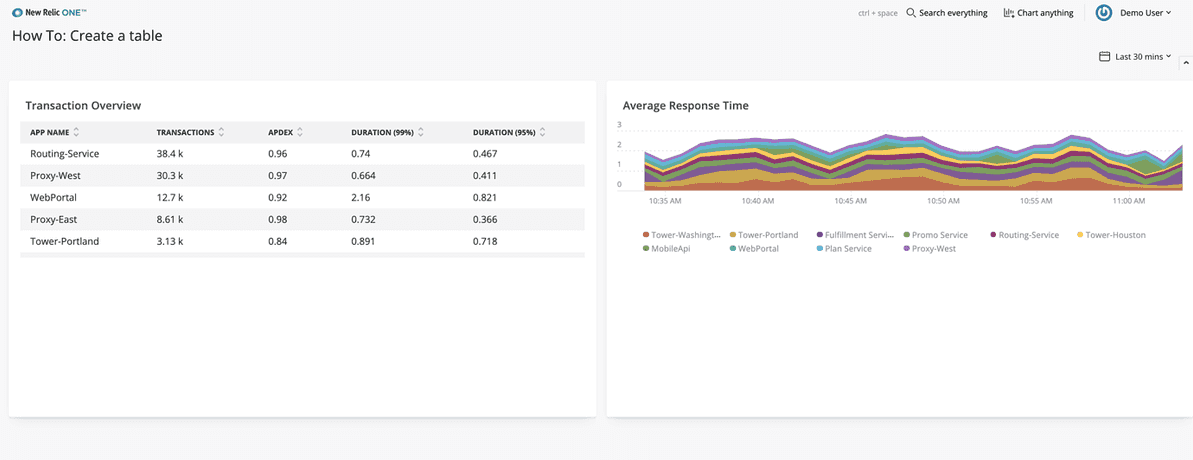
Have a good look at the demo app. There's a TableChart on the left side named Transaction Overview, with an AreaChart next to it. You'll use Table components to add a new table in the second row.

Work with table components
Navigate to the nerdlets/create-a-table-nerdlet subdirectory and open the index.js file.
Add the following components to the import statement at the top of the file so that it looks like the example:
TableTableHeaderTableHeaderCellTableRowTableRowCell
import { Table, TableHeader, TableHeaderCell, TableRow, TableRowCell, PlatformStateContext, Grid, GridItem, HeadingText, AreaChart, TableChart,} from 'nr1';Add a basic Table component.
Locate the empty GridItem in index.js: This is where you start building the table.
Add the initial <Table> component. The items property collects the data by calling _getItems(), which contains sample values.
<GridItem className="primary-content-container" columnSpan={12}> <Table items={this._getItems()}></Table></GridItem>;Add the header and rows.
As the Table component renders a fixed number of header cells and rows, your next step is adding header components, as well as a function that returns the required table rows.
Inside the Table component, add the TableHeader and then a TableHeaderCell child for each heading.
Since you don't know how many rows you'll need, your best bet is to call a function to build as many TableRows as items returned by _getItems().
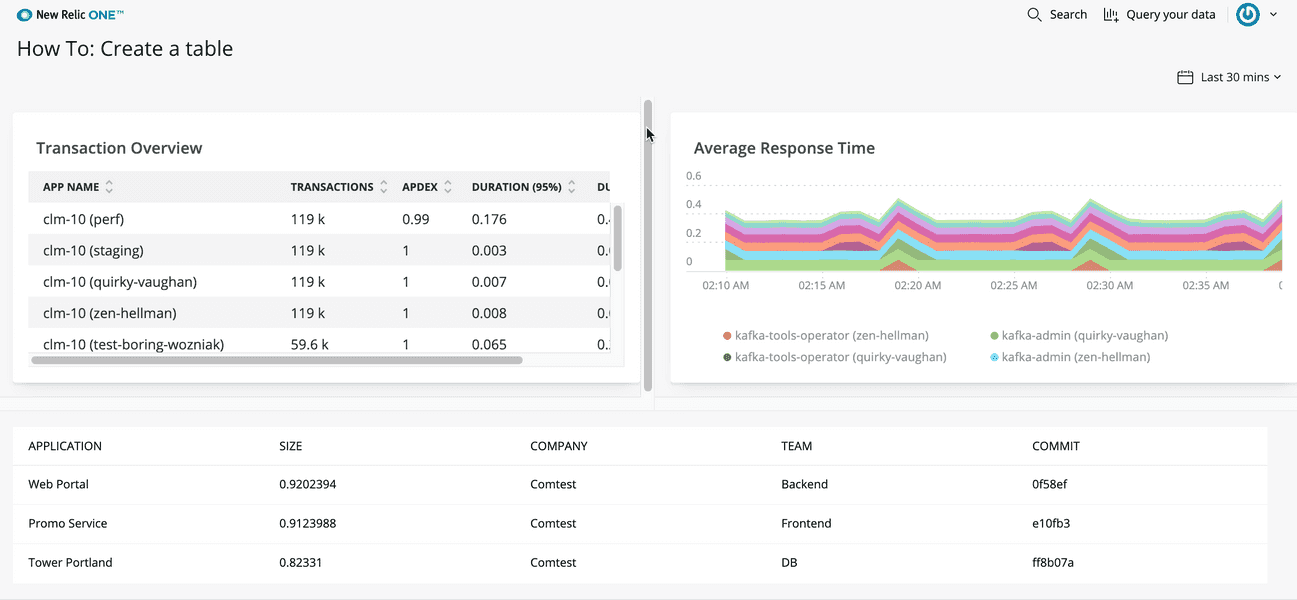
<TableHeader> <TableHeaderCell>Application</TableHeaderCell> <TableHeaderCell>Size</TableHeaderCell> <TableHeaderCell>Company</TableHeaderCell> <TableHeaderCell>Team</TableHeaderCell> <TableHeaderCell>Commit</TableHeaderCell></TableHeader>;{ ({ item }) => ( <TableRow> <TableRowCell>{item.name}</TableRowCell> <TableRowCell>{item.value}</TableRowCell> <TableRowCell>{item.company}</TableRowCell> <TableRowCell>{item.team}</TableRowCell> <TableRowCell>{item.commit}</TableRowCell> </TableRow> );}Take a look at the application running in New Relic: you should see something similar to the screenshot below.

Replace standard table cells with smart cells.
The New Relic One library includes cell components that can automatically format certain data types, like users, metrics, and entity names.
The table you've just created contains columns that can benefit from those components: Application (an entity name) and Size (a metric).
Before you can use EntityTitleTableRowCell and MetricTableRowCell, you have to add them to the import statement first.
import { EntityTitleTableRowCell, MetricTableRowCell, ... /* All previous components */} from 'nr1';Update your table rows by replacing the first and second TableRowCells with entity and metric cells.
Notice that EntityTitleTableRowCell and MetricTableRowCell are self-closing tags.
{ ({ item }) => ( <TableRow> <EntityTitleTableRowCell value={item} /> <MetricTableRowCell type={MetricTableRowCell.TYPE.APDEX} value={item.value} /> <TableRowCell>{item.company}</TableRowCell> <TableRowCell>{item.team}</TableRowCell> <TableRowCell>{item.commit}</TableRowCell> </TableRow> );}Time to give your table a second look: The cell components you've added take care of properly formatting the data.

Add some action to your table!
Tables are great, but interactive tables can be better: As a last update, you are going to allow users to act on each data row.
Add the _getActions() method to your index.js file, right before _getItems().
As you may have guessed from the code, _getActions() spawns an alert box when you click Team or Commit cells.
_getActions() { return [ { label: 'Alert Team', iconType: TableRow.ACTIONS_ICON_TYPE.INTERFACE__OPERATIONS__ALERT, onClick: (evt, { item, index }) => { alert(`Alert Team: ${item.team}`); }, }, { label: 'Rollback Version', iconType: TableRow.ACTIONS_ICON_TYPE.INTERFACE__OPERATIONS__UNDO, onClick: (evt, { item, index }) => { alert(`Rollback from: ${item.commit}`); }, }, ];}Find the TableRow component in your return statement and point the actions property to _getActions().
The TableRow actions property defines a set of actions that appear when the user hovers over a table row. Actions have a mandatory text and an onClick callback, but can also display an icon or be disabled if needed.
<TableRow actions={this._getActions()}>Go back to your application and try hovering over any of the rows: Notice how the two available actions appear. When you click them, a function triggers with the selected row data as an argument, and an alert displays in your browser.

Next steps
You've built a table into a New Relic application, using components to format data automatically and provide contextual actions. Well done!
Keep exploring the Table components, their properties, and how to use them, in our SDK documentation.